Often the test matches
start on Thursday and end on Monday. As Monday is a working day, a lot of
office goers face distraction from work as the last day of Test match is often the most
exciting day with lots of action. This scheduling pattern of test matches is also evident in the ongoing India-New Zealand Kanpur Test match as well which began
on 22nd September 2016, Thursday.
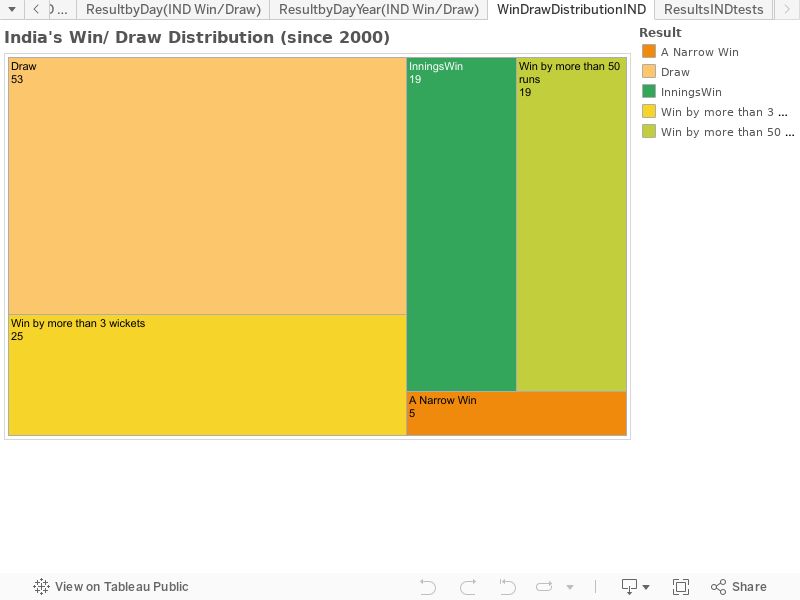
Based on these thoughts, I have created a visualisation on the performance of the Indian Cricket Team in Test matched since 2000 and have tried to see if there is an observable pattern of results by last day of a test match.
Here is the link for visualisation:
https://public.tableau.com/profile/n.singh#!/
Observation:
Wins and narrow wins have occurred in matches ending on Monday.
I categorised any test win by less than 50 runs or by less than or equal to 3 wickets as a narrow win.
Based on these thoughts, I have created a visualisation on the performance of the Indian Cricket Team in Test matched since 2000 and have tried to see if there is an observable pattern of results by last day of a test match.
Here is the link for visualisation:
https://public.tableau.com/profile/n.singh#!/
Wins and narrow wins have occurred in matches ending on Monday.
I categorised any test win by less than 50 runs or by less than or equal to 3 wickets as a narrow win.
Feedback and comments are highly solicited. If you believe that there is a discrepancy in the visualisation, please also point out the same as well.
Thanks.
Thanks.
References:


