The health insurance program for the people below poverty line was
launched in 2008. More details here:
https://en.wikipedia.org/wiki/Rashtriya_Swasthya_Bima_Yojana
Data sources:
- District wise data about the health insurance premium and
hospitalization expenses is available here: http://www.rsby.gov.in/Statewise.aspx?state=24
- District wise census data is available here: https://odisha.data.gov.in/catalog/primary-census-abstract-odisha#web_catalog_tabs_block_10
Data analysis:
- The two datasets were merged by district name and simple charts were created using scatter plots and maps.
- Female literacy percentage was calculated as number of female literates over total number of females.
- Enrollment percentage was calculated as enrolled families over total target families.
- Private percentage was calculated as number of private hospitals
empaneled to provide RSBY benefits over total number of public and
private hospitals empaneled.
- Data was grouped by District.
- Tableau was used as charting software tool.
Charts:
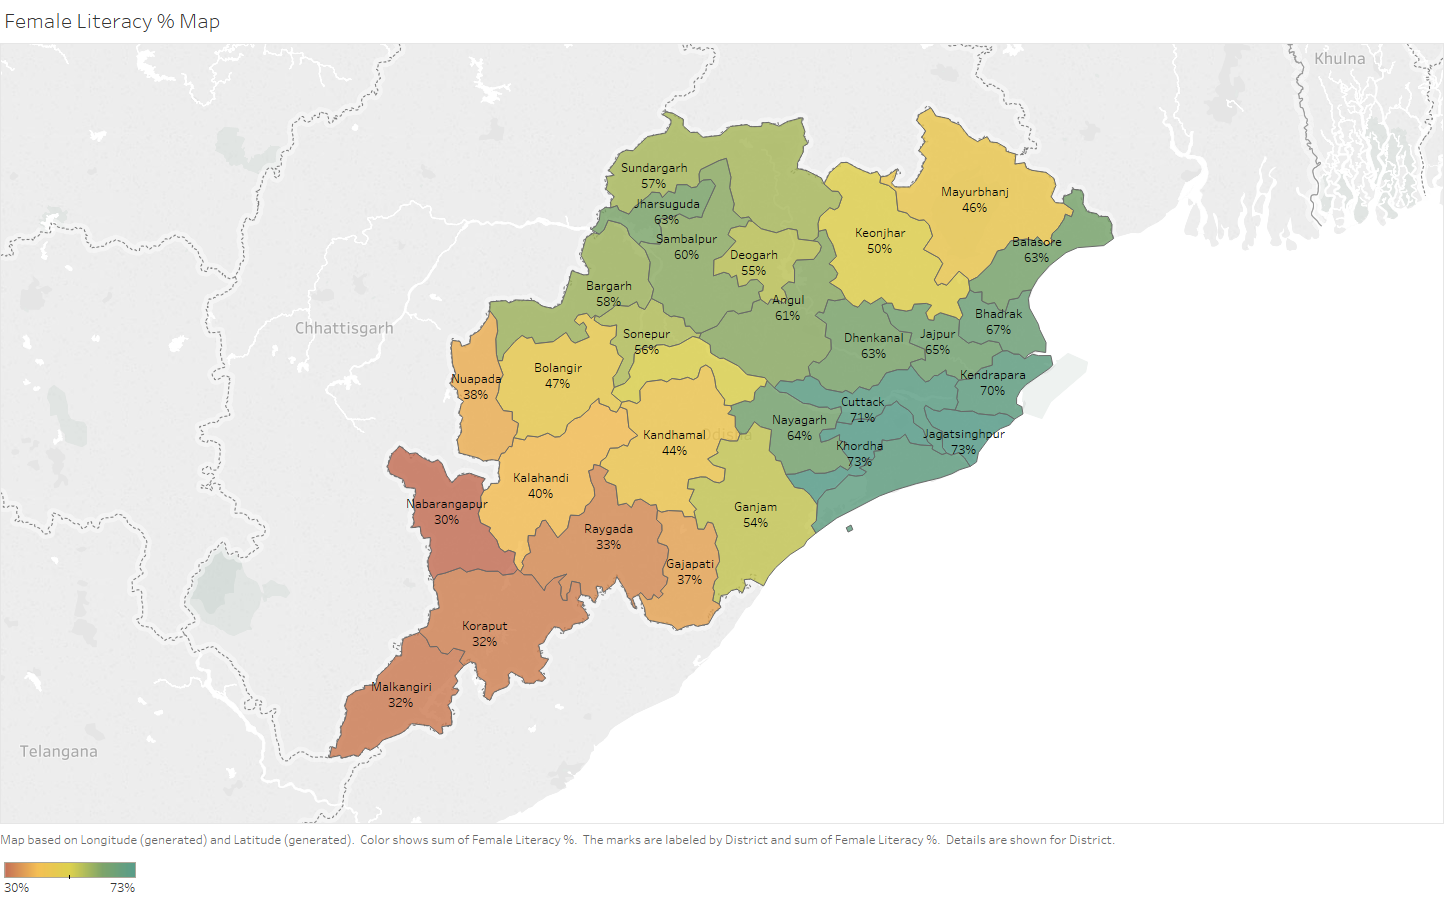
I started by displaying parameters by state map to give an overall understanding of the geographic distribution of parameters.
3 districts had 100% RSBY enrollment among the target families; Sonepur, Nayagarh and Kalahandi.
The average hospitalization expense was a mixed bag across districts
ranging from 889 rupees in Kandhamal to 7062 rupees in Jagatsinghpur.
Districts near capital city of Bhubaneshwar were equipped with both
public and private empaneled hospitals as compared to public hospital
majority regions. Khordha had 71% private hospitals empaneled to serve
patients under RSBY scheme.
The geographical spread of female literacy showed distinct areas of low, medium and high literacy.
After the geographical charts were plotted, I created some scatter plots to understand the interdependence of factors.
The private hospital had 14 times higher average hospitalization
expense as compared to a public hospital. (Slope of private graph trend
line is 85 while slope of public graph trend line is 6)
Overall hospitalization expense increased with the increase of private public mix of hospitals.
Hospitalization expense increased with the number of hospitalization.
Private hospital dominated districts can be seen as falling way above
the trend line.
Hospitalization expense = 2105 * Number of Hospitalization or 1
hospitalization resulted in 2105 rupees worth of expense on average.
Number of hospitalizations generally increased with the increase in
the number of enrolled families. Female literacy didn't appear as an
impact factor here.
Number of hospitalization = 0.05*Enrolled families or only 1 out of 20 enrolled families used the hospitalization facility.
Count of enrolled families under the RSBY scheme decreased with increase in female literacy, which was a surprise.
Average hospitalization expense increased with female literacy; which
shows that hospitalizations were lesser in number but more expensive
suggesting surgeries or accidental illnesses.
Conclusion
Few important observations come up after the analysis:
- Average hospitalization expense per family was 105 rupees whereas
premium was 370 rupees as mentioned on the webpage, i.e. claim ratio of
28%.
- The enrollment of target families is yet to be completed. Emphasis needs to be put on finishing enrollment soon.
- Use of private is meaningful only if they provide a medical
treatment that government hospitals can't or if they are located at a
place where there are no government hospitals.
- The data was available till September 2017. So there is a need to update the data on RSBY portal.